Customizable tabbed stages
Save a name, color, grid size, and widget layout for every stage. Move and resize widgets with drag and drop, with automatic collision handling.
Whale Watch is a browser-based workspace for observing Docker container resources, logs, and status through widgets you arrange—and operating containers from the same screen.
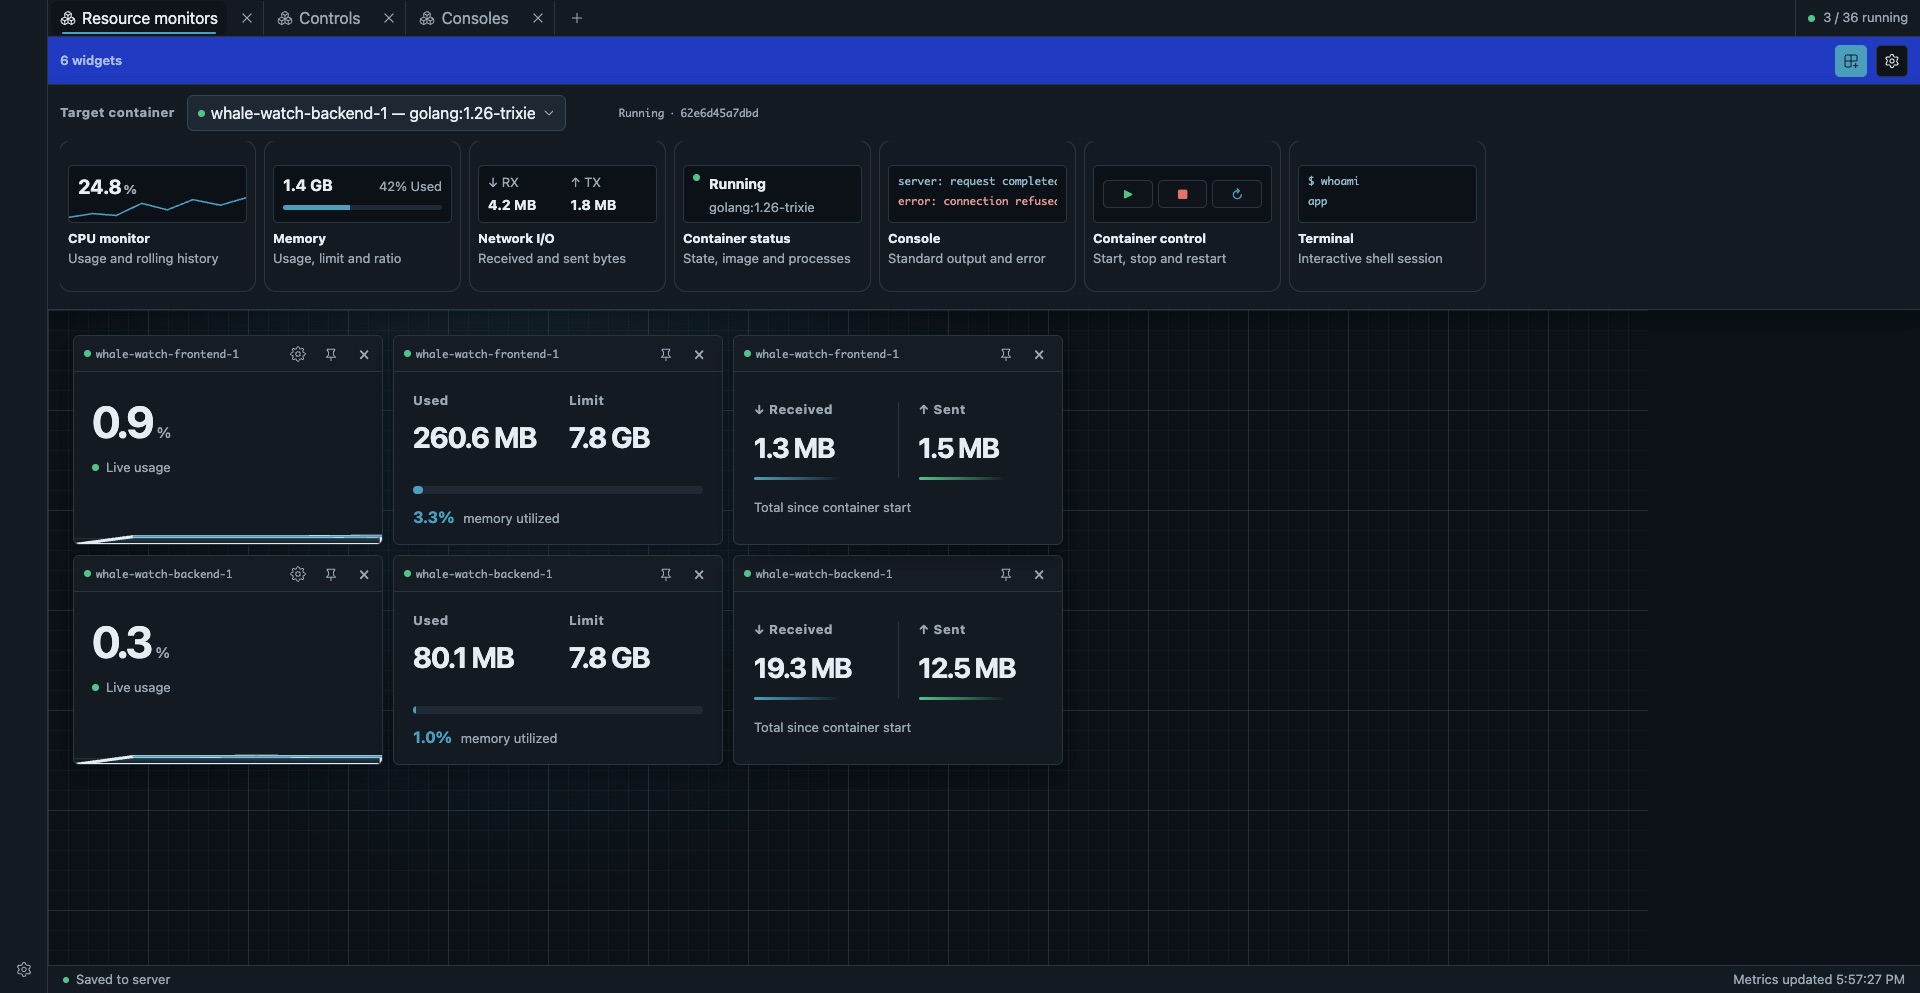
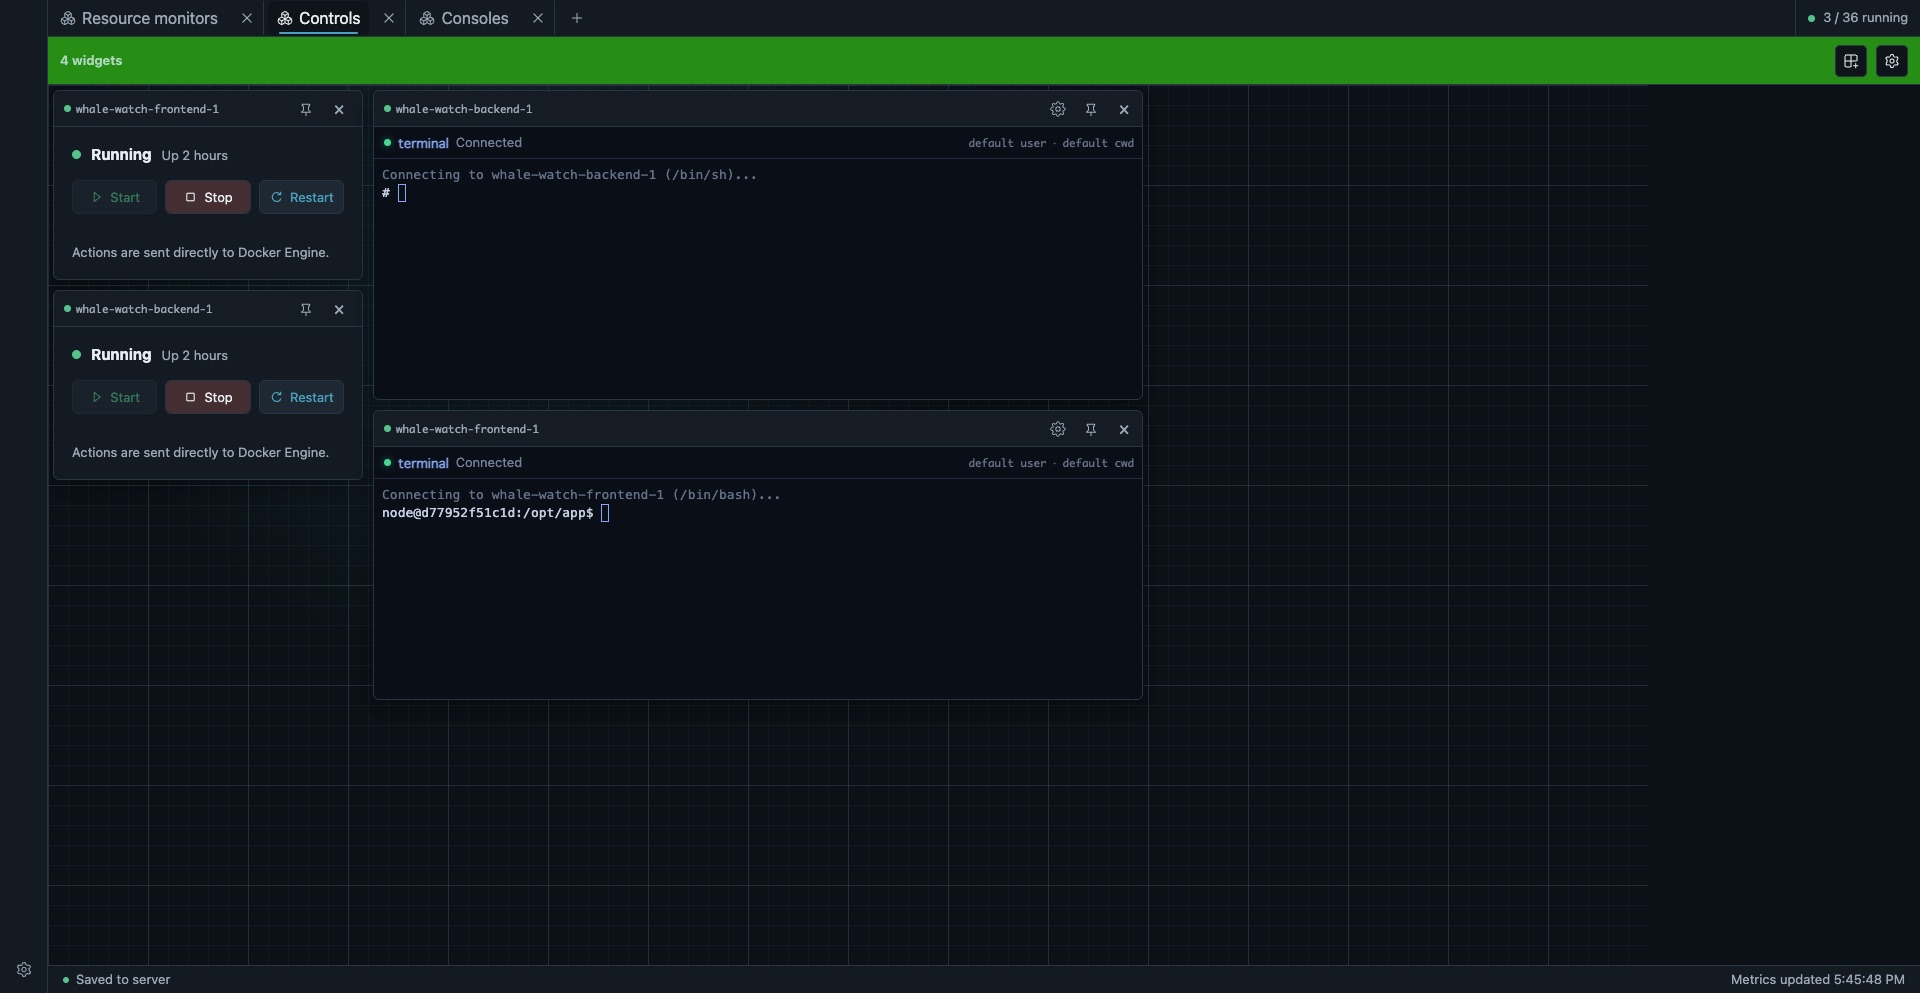
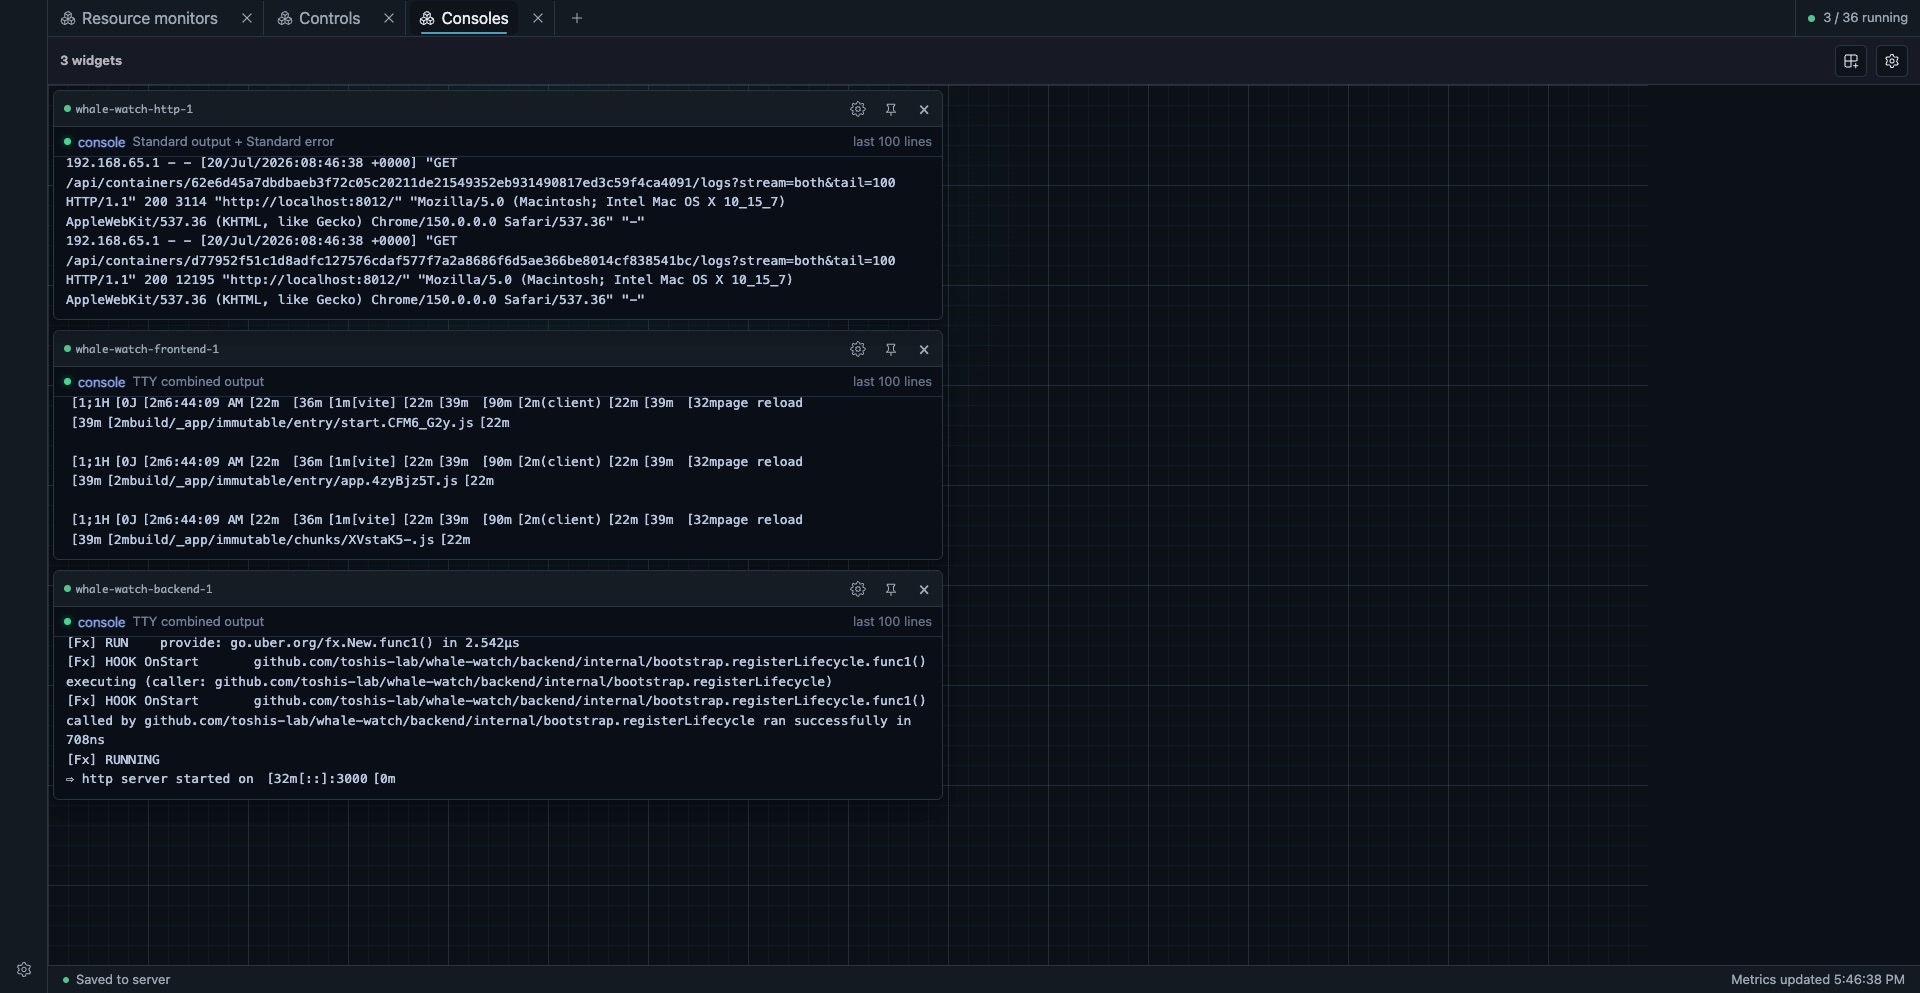
Whale Watch reads directly from the Docker Engine API without adding monitoring agents or packages to target containers. Organize tabs and widgets around each task.
Save a name, color, grid size, and widget layout for every stage. Move and resize widgets with drag and drop, with automatic collision handling.
Combine CPU history, memory, network I/O, and container status widgets for the view you need.
Read stdout and stderr logs, then open interactive TTY sessions powered by xterm.js and Docker exec.
Check container status and run lifecycle controls from the same browser workspace.
Docker events refresh the container list without fixed polling. On inactive tabs, only pinned widgets continue updating in the background.
The SvelteKit SPA is embedded in a Go application and distributed as one container. Mount the data directory to keep stage and widget settings between updates.
mkdir -p data
docker run -d --name whale-watch \
  --restart unless-stopped \
  -p 8080:8080 \
  -v /var/run/docker.sock:/var/run/docker.sock \
  -v "$(pwd)/data:/usr/local/bin/data" \
  toshislab/whale-watch:dev
Then open http://localhost:8080.
Compare resource usage across several containers in one view
Place service logs side by side while investigating issues
Restart containers and confirm their status on the same stage
Build a local workspace exposing only the containers you need
Start the Docker image and build a workspace around your development environment.